


|
|
|
|
|
In 2009 the parchment of the Voynich MS was subjected to radio-carbon dating and the result was that this parchment dates to sometime between 1404 and 1438 with 95% probability. The analysis was done in the frame of an ORF TV documentary, and the public announcement was made during a press conference on 8 December 2009. The radio-carbon dating was performed by the University of Arizona, and has been publicly presented at several occasions (1), but I am not aware of a published paper on this topic.
The radio-carbon dating results were described in an internal report, which was not released for a number if years. The present page has been set up in the meantime as an explanation of the relevant aspects of this analysis, for non-experts. It is not copying information from the internal report (except when specifically stated), but an independent explanation and calculation.
Since then, the internal report has been made available publicly (2). As it does not include any details about the methodology, the present page will still be helpful for people wishing to understand this better.
All organic matter is based on normal carbon, with a small fraction of different carbon. This normal carbon is denoted as 12C and the different carbon as 14C, where 14C atoms are not stable. Additional types ('isotopes') exist, for example 13C, but their role in this process may be left outside the present discussion. 14C atoms decay slowly but steadily. When an organism is alive, it will tend to have the same ratio of 12C and 14C as its environment, as it is in an equilibrium with this environment, because it feeds from it (breathing the atmosphere and feeding from other organic matter). However, when the organism dies, this feeding stops, and the decay of the 14C atoms begins. This decay follows an exponential trend, such that after about 5700 years only half of the original fraction of 14C remains. By measuring the ratio of 14C atoms to 12C atoms, and comparing it with the present time, one can see how much decay has taken place, and derive how old this organic matter is.
The Voynich MS has been written on parchment and parchment is made from animal skin. It can be dated based on the principle described above, and the result gives the time that the animal, whose skin was used, died.
One complication in this process is, that the ratio of 12C and 14C in the environment was not constant over time in the past centuries, or millennia. This fact has been established by comparing the 14C contents of trees that could be precisely dated using tree ring analysis.
A second complication is, that as from World War II nuclear detonations have generated large amounts of 14C in the atmosphere that has nothing to do with the natural decay process. As a result, the 14C content after 1950 is severely disturbed, and the year 1950 has been defined as the reference. In the radio-carbon dating world, 'before present' therefore means before 1950.
Had complication one not existed, a very simple and smooth curve would have allowed to date any item based on its 14C contents compared to the 1950 standard. Dates or ages computed in this way are referred to as un-calibrated.
Instead, based on the tree ring analysis, reality looks very different. In Figure 1a below, the smooth blue curve is the hypothetical relation between 14C fraction and age, while the more complicated red curve more closely represents reality reconstructed from the above-mentioned tree ring analysis (3). This second graph represents the so-called calibrated date. Both are shown for the time frame of interest for the Voynich MS, but can be used also for times much further in the past.
Figure 1a: The radio-carbon calibration curve.
In Figure 1b, un-calibrated and calibrated dates are shown against each other, with the un-calibrated date on the vertical scale.
Figure 1b: The radio-carbon calibration curve expressed in dates. Calibrated dates are on the horizontal
scale and un-calibrated dates on the vertical scale.
The discussion to decide which folio or folios to test started in 2008. There were large uncertainties related to the origin of the Voynich MS, with theories ranging between the 13th Century (Roger Bacon autograph), 15th Century (based on the style of the MS), around 1600 (Dee/Kelley fake MS) up to 1912 (fake by W. Voynich). Since it is possible that the Voynich MS was written over a longer time period, or perhaps using parchment from several different origins, it was considered important to take several samples. However, radio-carbon dating is a very expensive procedure, and the MS should not be damaged too much, so it was agreed between the group funding the research and the Beinecke library to use a maximum of four samples. These samples were selected to allow the largest possible variety and therefore possibly time range. More specifically, the following reasoning was applied:
The final decision on the samples to be taken was as follows:
| Fol. 8 | Herbal A, standard folio, thin parchment, Tepenec ex libris |
|---|---|
| Fol. 26 | Herbal B, standard folio, thin parchment, ink and pigments also sampled for chemical analysis |
| Fol. 47 | Herbal A, standard folio, thick parchment, ink and pigments also sampled for chemical analysis |
| Fol. 68 | Astronomical, foldout folio |
Table 1: the four samples that were taken from the Voynich MS for radio-carbon dating.
Following are the measured 14C content of the four samples as presented by G.Hodgins during the Voynich MS centenary event in Villa Mondragone on 11 May 2012. The error distribution of these measurements is assumed to be Gaussian and the sigma (standard deviation) of this distribution is also given. This standard deviation is based on the uncertainty of the measurement process (4).
| Fol. Nr. | Description | 14C fraction | Sigma |
|---|---|---|---|
| 8 | Herbal-A (Tepenec signature) | 0.9409 | 0.0044 |
| 26 | Herbal-B | 0.9380 | 0.0041 |
| 47 | Herbal-A (thick folio) | 0.9389 | 0.0041 |
| 68 | Astronomical foldout | 0.9338 | 0.0041 |
Table 2: measured 14C content for the four samples.
The probability distributions of the four measurements are shown together in Figure 2 below:
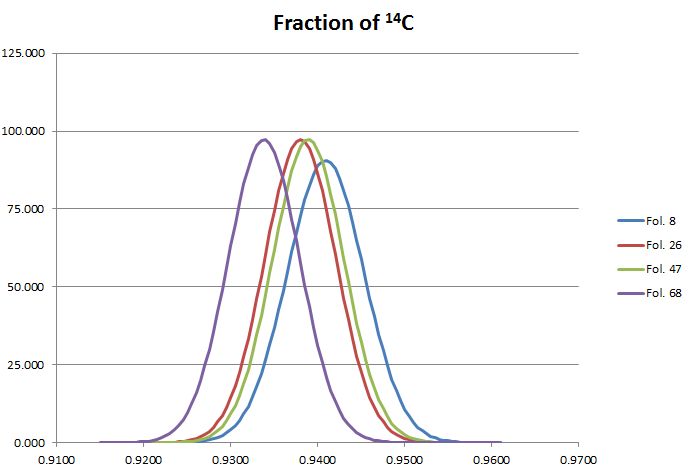
Figure 2: The probability distributions of the measurements for the four samples of the Voynich MS.
This shows in a very visual, yet qualitative way that the four measurements are consistent. There is no indication that the samples represent a different age.
The unweighted mean of the four observed values in the Table above is 0.9379, and the standard deviation of these four values is 0.0030. While a standard deviation of only four samples cannot have a high level of confidence, the value is well below the standard deviation of the individual measurements. In other words: the spread of the measurements is less than their inherent error. This quantitatively confirms the consistency of the measurements.
The red curve above, showing the relation between 14C fraction and age, was published by Reimer et al in 2013 (see note 3). This publication presents the relationship between un-calibrated age and calibrated age, where the un-calibrated age is derived from the 14C fraction using an exponential decay with a half life of 5568 years (5). The practical advantage of using un-calibrated age instead of 14C fraction is that the relation between un-calibrated and calibrated age is close to linear over the full range of its validity, going back tens of thousands of years before present. Apart from that, the quantity un-calibrated age is not particularly meaningful by itself.
The relation between 14C fraction and un-calibrated age is sufficiently close to linear in our range of interest, to consider also the un-calibrated age to follow a normal error distribution, and the age and standard deviation for the four sampled leaves may be computed as follows:
| Fol. Nr. | Age (before 1950) | Year | Sigma |
|---|---|---|---|
| 8 | 489 | 1461 | 38 |
| 26 | 514 | 1436 | 35 |
| 47 | 506 | 1444 | 35 |
| 68 | 550 | 1400 | 35 |
Table 3: un-calibrated ages and dates for the four samples.
The probability distributions may again be shown together in one graph:
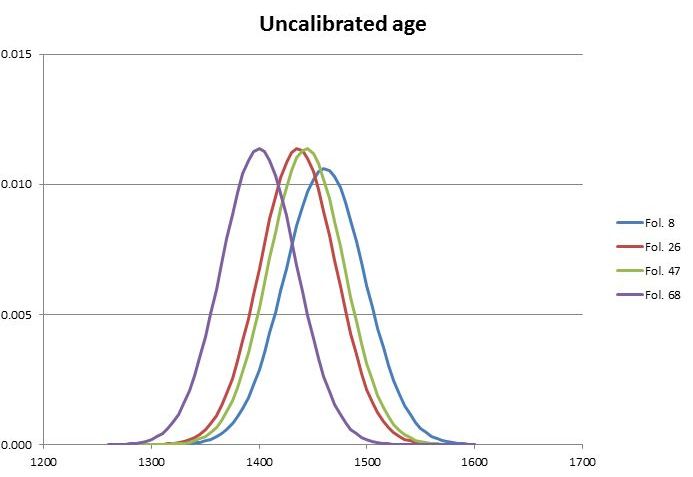
Figure 3: The probability distributions of the un-calibrated dates for the four samples of the Voynich MS.
In this case, the mean and standard deviation of the four measurements are 1435 and 26 years respectively.
The process to derive the calibrated age from the 14C fraction or the un-calibrated age can best be illustrated in several steps. Taking fol.26 as an example, one can see where the fraction 0.9380 intersects the red calibration curve and derive the calibrated age. Doing this results in the year 1420:
Figure 4: deriving calibrated date for fol.26 from the 14C fraction and the calibration curve.
However, both the measurement of the 14C fraction and the calibration curve have their uncertainties or errors, which need to be taken into account. Let us look at the uncertainty or error of the calibration curve first. The uncertainy is expressed as the standard deviation (sigma) of the 14C fraction as a function of the calibrated age (6). Figure 5 shows the calibration curve with plus or minus one sigma. This means that there is 68% probability that the 14C fraction corresponding to the calibrated year lies between the two green curves.
Figure 5: The 1-sigma uncertainty boundaries for the calibration curve.
The observed fraction of 0.9380 no longer results in a single date, but in a range of dates with a probability distribution, as shown in Figure 6:
Figure 6: The probability distribution for the calibrated date of fol.26, taking into account the uncertainty in the calibration curve.
This curve isn t exactly Gaussian anymore, and there is a 95% probability that the age of this folio lies between 1409 and 1429. However, this still does not take into account the uncertainty or error in the measurement of the 14C fraction. The effect of this may be visualised by showing the probability distribution of this measurement to the left of the vertical fraction scale. This is nothing else than the maroon curve shown in Figure 2.
Figure 7: The probability distribution of the 14C measurement of fol.26 shown next to the calibration curve.
The calculation to take this into account becomes a bit more complicated (7), but the result is shown in Figure 8 below for all four folios (8). The double peaks are caused by the fact that part of the probability curves of the 14C fractions also intersect with a local maximum of the calibraton curve around the year 1335.
Figure 8: the probability distributions of the calibrated dates of the four samples of the Voynich MS.
The dating of each folio doesn t allow a very precise dating of the MS. The uncertainty in age for each folio is some 50-60 years, and in the case of fol.68 even spans two centuries due to the above-mentioned inversions of the calibration curve. These folios have been bound together into one volume centuries ago, and the book production process is likely to have taken considerably less time than these 50-60 years. Under this assumption, and in particular the obtained result that the dating of the folios is tightly clustered (as shown above), each sheet provides a measurement or observation of the MS creation. Since they are likely to be from different animal hides, these are indeed independent observations. Combining these observations leads to a combined un-calibrated age of 1434 ± 18 years (1 sigma). The corresponding 14C fraction is 0.9379 ± 0.0021 (1 sigma). Applying the calibration curve to these values leads to the following combined age probability distribution for the Voynich MS:
Figure 9: the combined probability distributions of the parchment of the Voynich MS, from the four samples.
The 95% probability interval lies between 1404 and 1435 (9).
The higher limit deviates somewhat from Hodgins publication, but the simplifications that were made in the interpolation and integration steps are not believed to be significant (10). They have also been repeated with three different calibration curves: IntCal04, -09 and -13. This did not have any visible impact on the result (11). The above figures for the probability distributions for the individual folios and the combination cannot be distinguished visually from those in the internal publication.
The above describes the process used by the University of Arizona, and delivered to Yale. It was first summarised during the press conference mentioned in the introduction, together with a summary of the chemical analysis of the inks and pigments in the MS. Unfortunately, at this event, a statement was made that the analysis had demonstrated that the inks were applied immediately after the MS creation, but this statement was incorrect. The analysis did not provide any information about this. Specifically, the radio-carbon dating process desribed above provides the date of the parchment creation, with a probability of 95%. There's still a (statistical) probability of 5% that the date is outside this range.
One is of course more interested in the time that the MS was written. There is an unknown time between the creation of the parchment, and the time that the author(s) started applying the ink to it, and another unknown time for the author(s) to finish the work. Furthermore, there may be later entries in the MS, possibly by later owners (for example the month names in the Zodiac section), though these are of less consequence for this question.
At the time when the radio-carbon dating was published, it was already clear that many of the proposed theories about the origin of the MS were highly incompatible with these results, and presently I am aware of at least three new theories that propose much more recent dates for the MS. The authors of these theories then either need to argue that the above result is incorrect, or that the parchment must have been preserved unused for one or more centuries. While that is not impossible per se, we need to keep in mind that for the dating we are talking about a 95% proability range, and it is clear that such scenarios are way outside this range.
Similar to the Voynich MS, the Vinland map has been subjected to 14C analysis and it may be of interest to also present these results. All information is taken from Donahue et al. (2002) (12). The map itself consists of only one sheet, and several samples were taken from this sheet. These samples were processed sequentially, but all with different preparation (cleaning) steps.
The first sample resulted in a 14C fraction of 1.0176. A value greater than one could be considered impossible, but in practice it means that the Vinland map has been significantly contaminated by post-WW2 nuclear tests as mentioned in the introduction. Therefore, for all other samples more thorough cleaning processes were employed. The results in terms of 14C content are shown in Table 4 below, where 'Process Code' refers to different cleaning processes:
| Sample Process Code |
14C fraction | Sigma |
|---|---|---|
| B (1) | 0.9588 | 0.014 |
| B (2) | 0.9507 | 0.0035 |
| C | 0.9353 | 0.006 |
| D | 0.9412 | 0.003 |
| E | 0.9310 | 0.008 |
Table 4: results for samples of the Vinland map that were subjected different cleaning processes.
These values are all below 1, which shows that the cleaning has apparently successfully removed the post-WW2 contamination. Similarly to above, these values may be converted to un-calibrated age:
| Sample Process Code | Age (before 1950) | Year | Sigma |
|---|---|---|---|
| B (1) | 338 | 1612 | 117 |
| B (2) | 406 | 1544 | 30 |
| C | 537 | 1413 | 52 |
| D | 487 | 1463 | 26 |
| E | 574 | 1376 | 69 |
Table 5: un-calibrated ages and dates for samples of the Vinland map that were subjected different cleaning processes.
The following graph shows the probability distributions for these five 14C fractions:
Figure 10: The probability distributions of the measurements based on the five different cleaning
processes for samples of the Vinland map.
In a qualitative sense, the consistency is clearly not quite as good as that for the Voynich MS. It should be kept in mind
that the situation here is quite different from the one above. For the Voynich MS we had four samples from different pages.
Here, we have samples from the same page, but with different cleaning processes. To find a combined result, the paper
computes a weighted average of the five samples
(13),
which is:
0.9434 ± 0.0033
The paper states that each of the individual measurements is essentially consistent (to the level of their uncertainties) with this average, which is statistically correct, even though it is not intuitive from the above graph.
This combined 14C fration is equivalent with an un-calibrated age of 1482 ± 28 years (the paper has 1483 ± 27). Using the same process as above, the age probability distribution for the Vinland map is as follows (shown together with the Voynich MS):
Figure 11: The probability distribution of the calibrated date of the Vinland map, shown together with that of the Voynich MS.
At least it could be established that the parchment on which the map is drawn predates Columbus' voyage to the Americas.
I am grateful to the Velinska family for feedback on the original text. I could hopefully make the text understandable for people with different levels of knowledge about statistics.
![]()
|
|
|
|
|